
Why does the construction method decide more than the OLT?
A PON is quoted in two halves. The active half — OLT boards, ONUs, optics — arrives on a pallet and can be replaced in a maintenance window. The passive half, the optical distribution network, is dug or strung once and then lives for twenty years, and industry estimates put it at roughly 60% of a build cost. That is why the route decision is made before the equipment list, not after it.
The cost gap between the two methods is not a rounding error. The 2025 Fiber Deployment Cost Annual Report, produced by the Fiber Broadband Association with Cartesian from operators and contractors across 38 US states, puts the median deployment cost at $18.00 per foot underground against $8.00 per foot aerial. Labour is the largest single line in both: 72% of an underground build and 64% of an aerial one.
Cost is only half the decision. The method also fixes how many splices and connectors sit between the OLT port and the ONU, and that number goes straight into the passive budget, the split ratio and the number of ONUs one port can serve. An aerial route with a closure every span is not the same network as a duct route spliced once at each end, even when both use the same splitter and the same ONU model.
What does each method cost per foot, and per home passed?
Use the per-foot figures as an envelope, not a quote. They set the order of magnitude for a feeder route, and they tell you where the money is: in both methods labour outweighs materials, so crew productivity, weather and make-ready work move the number far more than cable price does.
The same survey series is the most useful benchmark available for cost per home passed, because it is collected from operators rather than estimated from a bill of materials. Reported values mostly fell between $700 and $2,700 per home passed, with underground builds at the top of that range. Note what that means for a business case: a $10 per foot difference on a 12 km feeder is about $390,000 before a single ONU is installed.
| Cost line | Aerial | Underground | What it decides |
|---|---|---|---|
| Median cost per foot, 2025 | $8.00 | $18.00 | The budget envelope for the feeder |
| Labour share of that cost | 64% | 72% | Whether internal crews change the case |
| Median labour cost per foot | $4.50 | $12.23 | Crew productivity and weather risk |
| Construction variants | Strand or lashed span on ready poles | Trench, plough, bore or micro-trench | Trenching costs about 60% more than ploughing |
| Direct burial against new conduit | Not applicable | About 40% cheaper without new duct | Flexibility traded for capital |
| Reported cost per home passed | Under $700 to $1,500 in suburban and urban areas | $1,600 to $2,600 | Homes-passed funding and payback |
Per-foot medians from the FBA and Cartesian 2025 report (38 states); cost per home passed from the 2023 edition of the same study series. Both are survey medians, not quotations.
What does an aerial route add to the optical budget?
An aerial span needs a closure wherever the cable is spliced, and that is usually more often than in duct: at every branch, at every road crossing that changes the span, and wherever slack has to be stored. Each closure adds splices, and each splice takes loss out of the same budget that pays for the splitter.
The planning figures are stable and worth memorising: fibre attenuation maxima of 0.35 dB/km at 1310 nm and 0.20 dB/km at 1550 nm for G.652.D, about 0.1 dB per fusion splice, and 0.5 dB per mated connector pair. Aerial plant also moves. Wind, ice and thermal cycling work on the span, so connector hygiene and closure sealing matter more than they do in a duct, and bend-insensitive fibre is worth specifying on the drop side of the last closure.
The table below runs one 12 km feeder both ways with the same splitter. The difference is small in decibels and decisive in margin: the aerial version keeps 0.8 dB after a 3 dB ageing reserve, which is not enough to accept a 1:64 split on the same route later.
| Budget line | Duct route, 12 km | Aerial route, 12 km |
|---|---|---|
| Fibre loss at 1310 nm, 0.35 dB/km | 4.2 dB | 4.2 dB |
| Splices, 0.1 dB each | 12 splices: 1.2 dB | 20 splices: 2.0 dB |
| Connector pairs, 0.5 dB each | 2 pairs: 1.0 dB | 3 pairs: 1.5 dB |
| Splitter, 1:32 | 16.5 dB | 16.5 dB |
| Total, OLT connector to ONU connector | 22.9 dB | 24.2 dB |
| Margin against a 28 dB class | 5.1 dB | 3.8 dB |
| Margin after a 3 dB ageing reserve | 2.1 dB | 0.8 dB |
Attenuation per ITU-T G.652.D maxima; splice and connector values are planning figures. Replace every line with measured values before the splitter order is frozen.
Where should the splitter sit when the plant is aerial?
There are three practical positions, and the method constrains all of them. A splitter in an aerial closure keeps the feeder short and the drops short, but a pole-mounted closure has little room for extra ports, is reached by ladder or bucket truck, and is the least pleasant place to re-split later. A street cabinet costs civil work but gives room to re-split and to keep spares. A basement or riser position in the building serves the shortest drops and is the easiest to service, at the price of a longer feeder.
The decision follows the same three numbers as any splitter choice: how many subscribers the port must serve, how far the worst-case subscriber is, and how much margin the route already spent. On the aerial example above, 0.8 dB of margin after reserve is not a port you want to re-split at 1:64 in three years, so the splitter belongs where a 1:16 or 1:32 can be added without touching the pole plant.
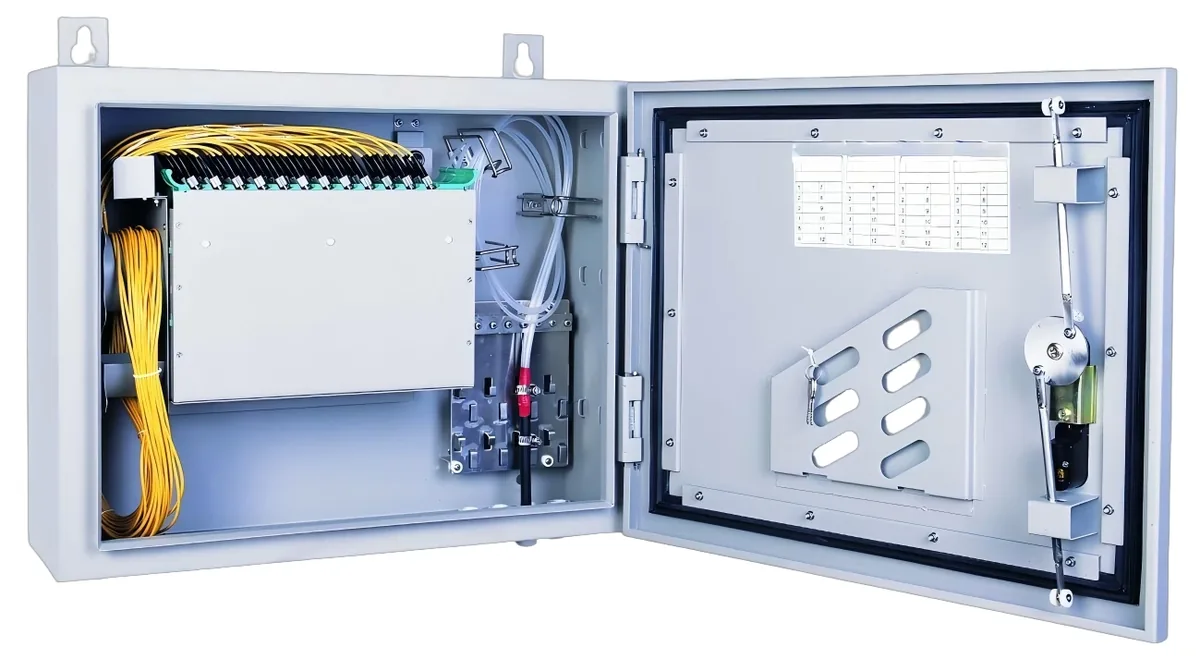
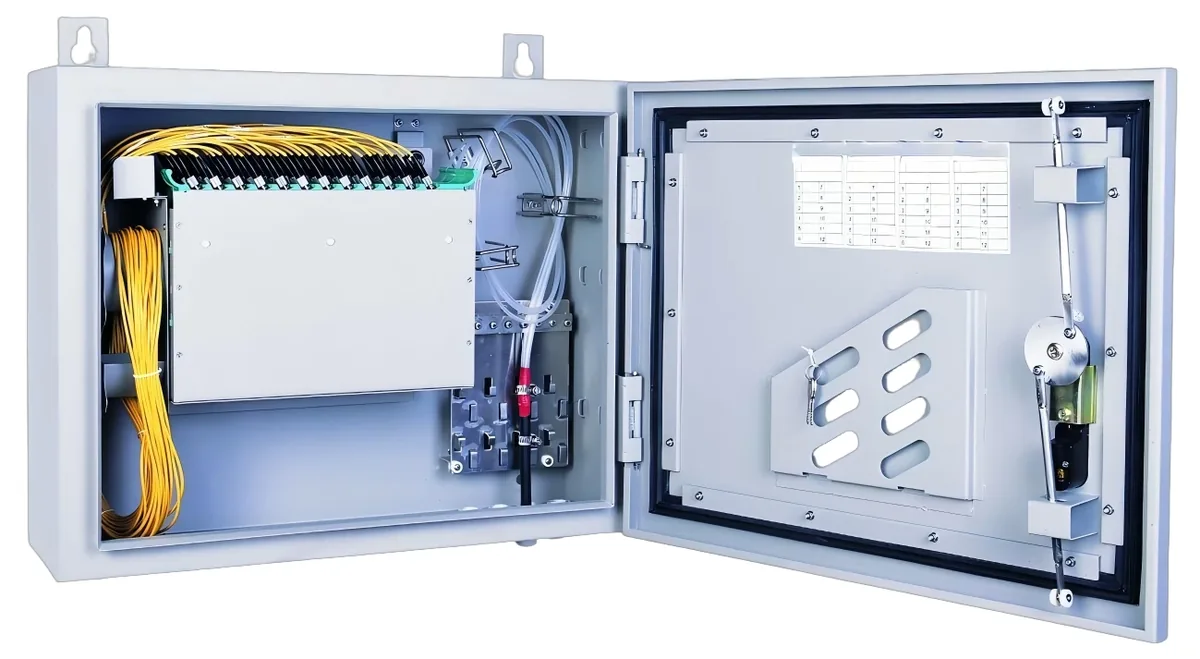
Port count and split ratio are quoted per module, so the closure or cabinet has to be sized for the final ratio rather than the first one. The fibre splitter family lists 1:2 to 1:64 modules with their insertion loss, and the splitter ratio guide carries the loss table; the ODF and enclosure page covers the termination and storage side of the same decision.
Which method costs more to run?
Aerial capex is lower; aerial opex is not automatically lower. In exposed territory the failure modes are wind, ice loading, sag, vegetation, vehicle strike on a pole and the odd errant lorry, and almost all of them are visible from the street, which at least makes localising the fault quick. Underground failures are rarer and harder: a dig-in or water ingress in a duct shows up as loss at the far end, and finding it needs a trace and often a joint.
Both methods carry costs that never appear on the construction invoice. For aerial, pole attachment fees and make-ready work are recurring items, and the 2025 report names make-ready and permitting among the main contributors to cost growth, with 92% of respondents reporting higher costs in 2025 and 88% expecting another rise in 2026. For underground, the ducts and chambers have to be maintained and the route kept clear.
The cheapest way to compare is mean time to repair multiplied by the fault rate, not the fault rate alone. A method that fails twice as often but is repaired in two hours can be cheaper to run than one that fails once and takes two days, and the difference usually comes down to how much of the route is accessible without excavation.
Why is the drop different from the feeder?
The last 50 to 300 metres is a separate design problem. Aerial drops leave the closure, cross to the building and enter at the eaves, so the cable has to survive movement at the attachment and a tight bend at the entry; that is where bend-insensitive G.657.A2 fibre earns its place rather than the G.652.D used on the feeder. Buried drops need a duct, a chamber and a sealed entry, and the entry is where water gets in if nobody checks it.
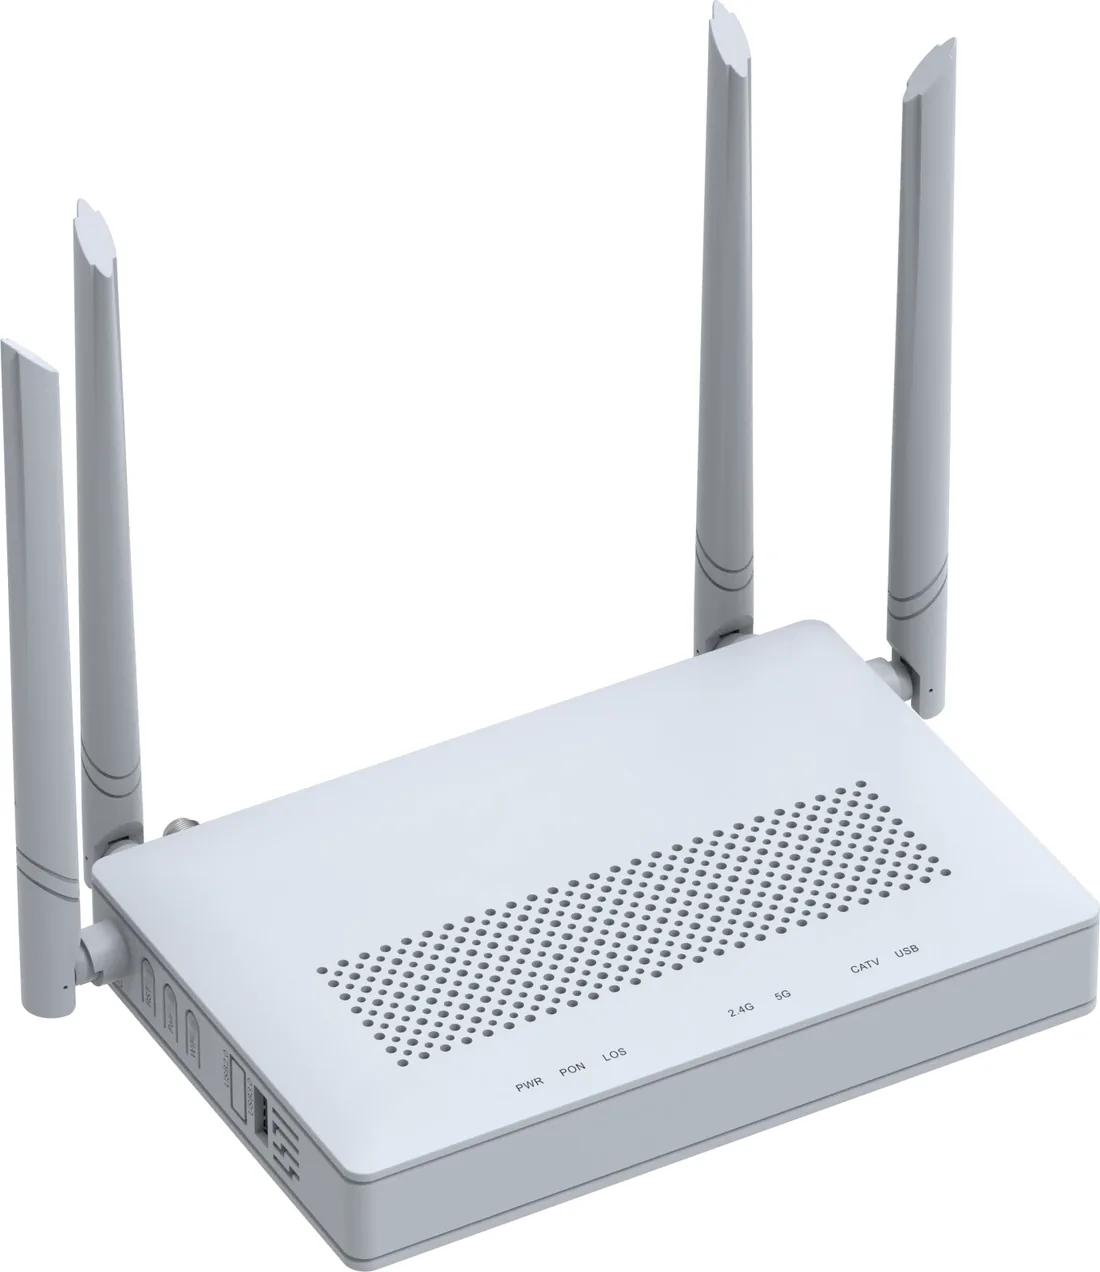
The ONU end of the drop is also where the site decides its power model. A ceiling or corridor ONU fed from a local socket is simple until there is no socket; a PoE-powered ONU moves the power source back to a switch or a port that already has backup. The GPON ONU/ONT and PoE ONU pages list the port and power options per model, and the surge protection note covers the earthing that an outdoor drop makes mandatory rather than optional.
Can one ODN mix both methods?
Yes, and most real networks do. A common pattern is an aerial feeder along a pole line with buried drops into each building, or a buried feeder to a cabinet with aerial distribution over the last few spans where poles already exist. The method changing mid-route is not a problem for the optics; it is a problem for the records if nobody writes down where the change happens.
Two rules keep a mixed ODN manageable. Keep the splitter at a fixed, accessible point rather than at a transition, and record the splice count and the measured loss for each span separately, so a later fault can be localised to a method. Where fibre and copper share a route, the hybrid cable note explains what a combined cable does to the pulling and termination plan.
What belongs in the bid and in the as-built?
A construction bid that cannot be read against a passive budget is a bid that will be renegotiated. Ask for quantities per span — metres, closures, splices, connector pairs — and for the method at each section, then run the same table as above with the contractor numbers in place of the planning figures. The optical link budget guide is the form to fill in; the split-ratio check is the splitter planning field note.
The as-built should carry four things the next engineer will need: route method per section, measured loss per span at the working wavelength, splitter position and ratio with its per-port data, and the connector polish at every termination. Everything else — cable type, closure model, pole numbers — belongs in the same document, but those four decide whether the OLT, the splitter and the patch cords can be re-ordered without a site visit.
Send the route length, the method per section, the worst-case span and the split ratio you intend to keep: send the site data or ask on WhatsApp. The OLT port count, the splitter modules and the ONU chain can then be quoted against the plant you are actually building, aerial or buried.
- Route method and length for every section, with the transition points marked.
- Closure count and splice count per span, not a site total.
- Splitter position, ratio, per-port measured loss and the band it is rated for.
- Connector polish at both ends of every patch, recorded.
- Measured end-to-end loss per PON port, at the wavelength that will be used.
Use this on a real site
Send the endpoint count, the longest run, the mains condition and the load. We will apply this calculation to your project and return the optical/power budget with the bill of materials.